Monday, March 18, 2013

3/11 Introduction to Sound

Purpose
     The purpose of this experiment was to gain knowledge and understanding of sound waves by examing their characteristics such as the number of wave, frequency, period, amplitude, and wavelength. The relationships between these variables were calculated through different sound waves.

Part 1
 
Set up
 
 
First person said "AAAAAA"
 
 
Wave #1
 
 
Questions answered
 
 
Wave #1h (sample was 10 times longer than #1)
 
 
Graph #1 showed that the prediction was consistent with the experiment.
Part 2
 
Someone else said "AAAAA"
 
 
Wave # 2
 
 
Questions answered 
 
 
Part 3
 
 
Tunning fork wave collected
 
 
Wave # 3
The major difference of waves between human voice and a tunning fork: human voice wave is not sinusoidal (superposition of different waves) but a tunning fork wave is sinusoidal.
 
 
Part 4
 
 
Wave # 4: tunning fork created a soft sound.
 
     Wave 3 and 4 were created by a sound from the same tunning fork but with different loudness; therefore, they were expected to have the same wavelength and frequency but different amplitude because the loudness is dependent on the amplitude of the wave. The sound of tunning fork was made softer by striking it softer. The experimental data proved that the louder sound has a larger amplitude.


Friday, March 8, 2013

3/6 Standing Wave

Purpose

     The purpose of this experiment was to understand the standing wave driven by external force.

Experiment

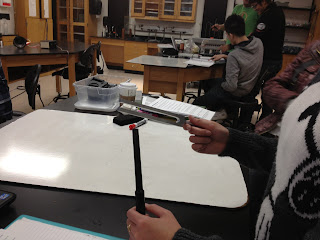
     The experiment was set up as the picture showed:
 
Data

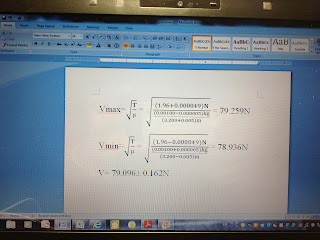
T= 1.96±0.000049N
Correction: the number of node was the number shown plus 2.
 
T= 0.49±0.000049N
 
Questions
 
     1. Found the wavelength and n for case 1, where T= 1.96±0.000049N.
                                  n= # of node -1
                                  L= nλ/2
                                  λ= 2L/n

Mode
ƒ(Hz)
Number of nodes
Distance between nodes(m)
λ (m)
n
fundemental
24±1
2
1.800±0.005
3.600±0.005
1
1st
47±1
3
0.900±0.005
1.800±0.005
2
2nd
71±1
4
0.600±0.005
1.200±0.005
3
3rd
94±1
5
0.450±0.005
0.900±0.005
4
4th
110±1
6
0.360±0.005
0.720±0.005
5
5th
150±1
7
0.300±0.005
0.600±0.005
6
6th
173±1
8
0.257±0.005
0.514±0.005
7
7th
195±1
9
0.225±0.005
0.450±0.005
8

 
     Found the wavelength and n for case 2, where T= 0.49±0.000049N
          
Mode
ƒ(Hz)
Number of nodes
Distance between nodes (m)
λ (m)
n
fundemental
10±1
2
1.800±0.005
3.600±0.005
1
1st
20±1
3
0.900±0.005
1.800±0.005
2
2nd
25±1
4
0.600±0.005
1.200±0.005
3
3rd
 ---
5
 ---
 ---
4
4th
45±1
6
0.360±0.005
0.720±0.005
5
5th
55±1
7
0.300±0.005
0.600±0.005
6
6th
65±1
8
0.257±0.005
0.514±0.005
7
 Note: the wave for third harmonic was hard to see.
 
     2. Plot of ƒ vs. 1/λ, where T= 1.96±0.000049N
 

% difference = (89.143-79.096/89.143) *100% = 11.3%
 
     3. Plot of ƒ vs. 1/λ, where T= 0.49±0.000049N


% difference = (39.599-32.786/39.599) *100% = 17.2%
 
     4. 
 
      5.
 
 
     6. 
 
Source of errors
The percent difference of the propagated speed from the plot and calculated from foumula v= sqrt T/u was 11.3%, where the tension was 1.96±0.000049N, and 17.2%, where T= 0.49±0.000049N. Possible errors could be the string we used streched when generating a wave; the mass hung did not provide enough tension, thus the string vibrated and affecting the generation of the wave.


3/4 Relationship between wavelength and frequency

Purpose
     The purpose of this experiment was to explore the relationship between wavelength and frequency.

Procedure
  • Two people held each end of the spring and stood 3m away from each other.

  • Put a piece of tape on the spring.
  • One person started pulsing one end of the spring until one wavelength was produced.
  • Started timing when the tape was on its peak.
  • Recorded the time that took the tape reached its peak 10 times.
  • Repeated the same steps for two more trials.
  • Conducted the same experiment when two people stood 4m and 5m away from the each other.

Data and Calculation
 
Wavelength (m)
Time 1 (s)
Time 2 (s)
Time 3 (s)
Tavg (s)
T (s)
ƒ (Hz)
λƒ
3.000±0.005
4.01
4.02
4.02
4.02 ±0.20
0.402 ±0.020
2.489 ±0.090
7.467±0.280
4.000±0.005
4.93
5.05
4.99
4.99 ±0.06
0.499 ±0.006
2.004 ±0.024
8.016±0.106
5.000±0.005
5.57
5.58
5.59
5.58 ±0.01
0.558 ±0.001
1.792 ±0.003
8.960±0.024


Conclusion
      The product of wavelengh and frequency were close to each other with different wavelenghs. The relationship beteween wavelenght and frequency was λ=constant/ƒ (inverse). This constant was the propagated speed of the wave.

Tuesday, March 5, 2013

2/27 Fluid Dynamics

Purpose

     The purpose of this experiment was to determine the time required to partially empty the water inside a bucket through a small hole on its bottom. The Bernoulli equation was applied to calculate the theoretical time to partially empty the bucket. The percent error was calculated to determine the uncertainties and perform error analysis.

Experiment

 
1. Set up: a bucket with a small hole was placed on the edge of the table
 
 
2. Once the set up is ready, the tape was removed to allow the water pour into the beaker and started timing. Once 200 mL of water was collected in the beaker, stopped timing and pasted the tape.
 
Data and Calculation
 
 
Conslusion

 
     The data was outside the allowlable range of errors, and they were off by a factor of two. Possible errors could be: the diameter of the hole was not small enough to to be applied in the Bernuolli equation; the height of the water was changing as the water being poured out, but we put the height as a constant when calculated the theoretical time; water was spilled during the experiment; after the first trial, the beaker became wet instead of dry, thus affecting the time; there might be an error on timing because of the reaction time. The errors also could be from the design and procedure of this lab.


Sunday, March 3, 2013

2/25 Fluid Static


Purpose
    
     The purpose of this experiment was to measure the buoyant force acting on an object three different ways and compared the three measurements.

Part A. Underwater Weighing Method

    The weight of the metal cylinder in air was measured to be 1.029N.

    The weight of the metal cylinder completely submerged in water was 0.734N.


 B= mg-T
mg = 1.029 ± 0.0005N
T = 0.734 ± 0.0005N
B = 0.295 ± 0.001N
 
 
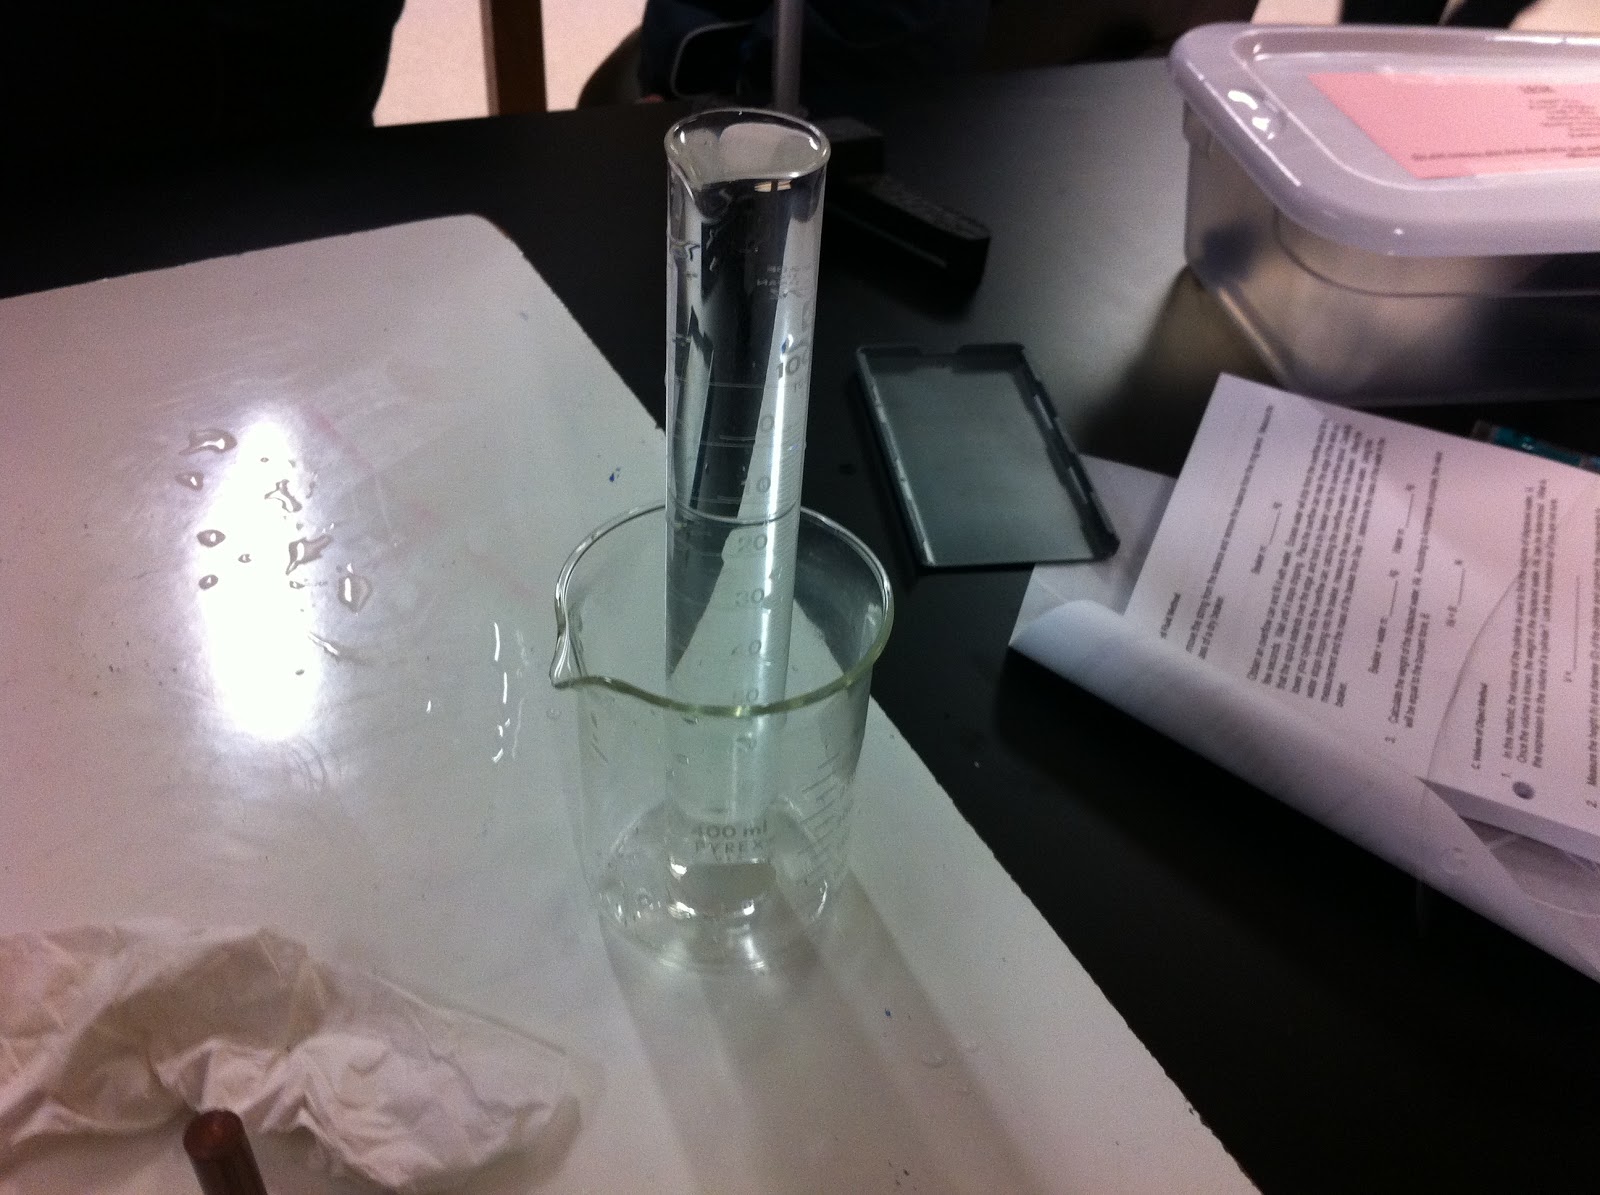
Part B. Displaced Fluid Method


         The mass of a dry beaker: 0.146±0.0005 kg.
        The mass of beaker plus water overflow: 0.186±0.0005 kg.
        The mass of water: 0.040±0.001 kg
        Wf = B = 0.392±0.098N
 
Part C. Volume of Object Method
 
     In this part, the volume of the metal cylinder was measured using caliper. The data obtained was
       shown as the following:

     h = 0.076 ± 0.0005 m
     d = 0.025 ± 0.0005 m
     V= 3.733*10^(-5)± 1.732*10^(-6) m^3
     B = 0.366 ± 0.017 N

Questions
  1. The buoyant forces of the three method appear to be closed. Some possible erros might be  that water was not completely transferred into the beaker in method 2, and there is some amount of water left over on the side and surface of the equipment. This is why methond 2 has the greatest uncertainty. However, the three forces are overall precise.
  2. The most precise method is the underwater weighting method because there are fewer errors since there are fewer measurement, and the only measurement of the force was measured by the computer. Also, it has the smallest uncertainty compared to the other methods, which is 0.001N. Displaced fluid water method has a lot of uncertainty due to the transfer of water such as spilling and residual water left on the surface of the equipment. Volume of method involved in a lot of measurements, which could cause in a greater error.
  3. If there is a normal force, then the reading on the force probe is smaller because now there is one more upward force in addition to the buoyant force. Therefore, the tension will be smaller. Then the boyant force is calculated using mg-T, causing a greater buoyant force.