The purpose of this experiment is to determine the planck's constant by measuring the ranges of light emitted by different colored LEDs through a diffraction grating.
Experiment

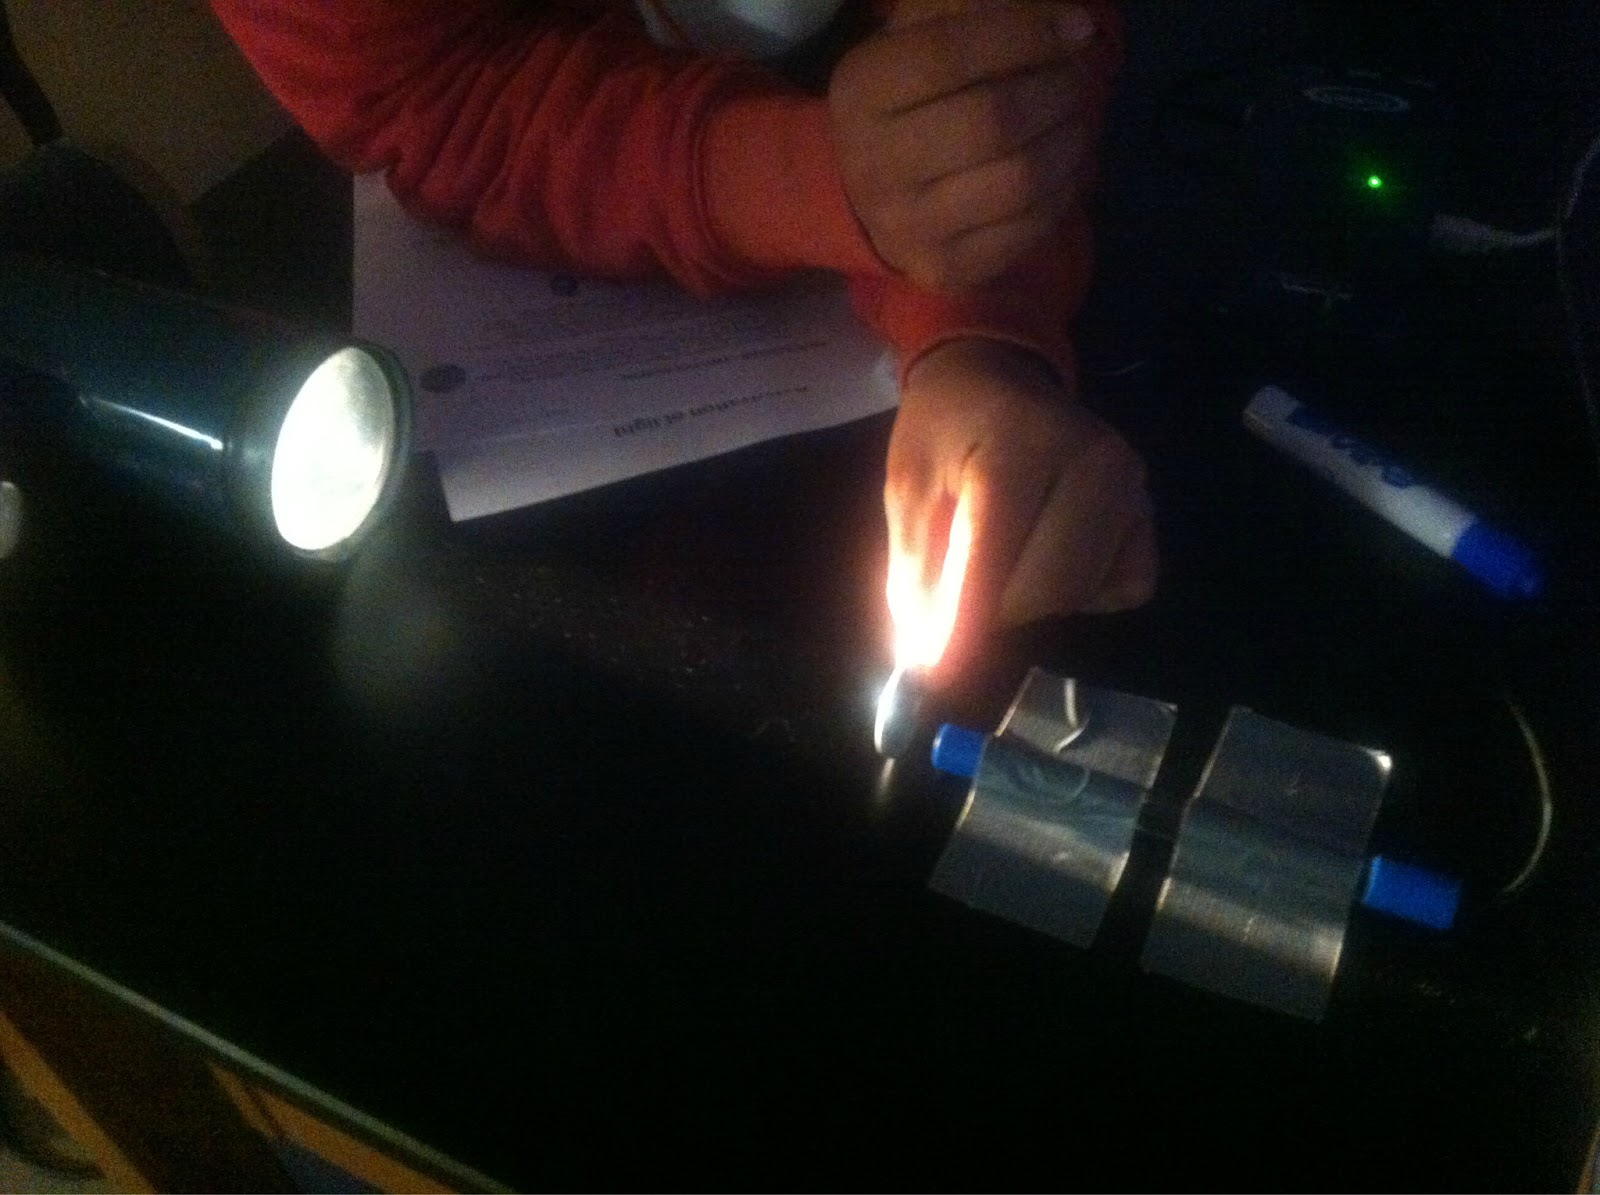
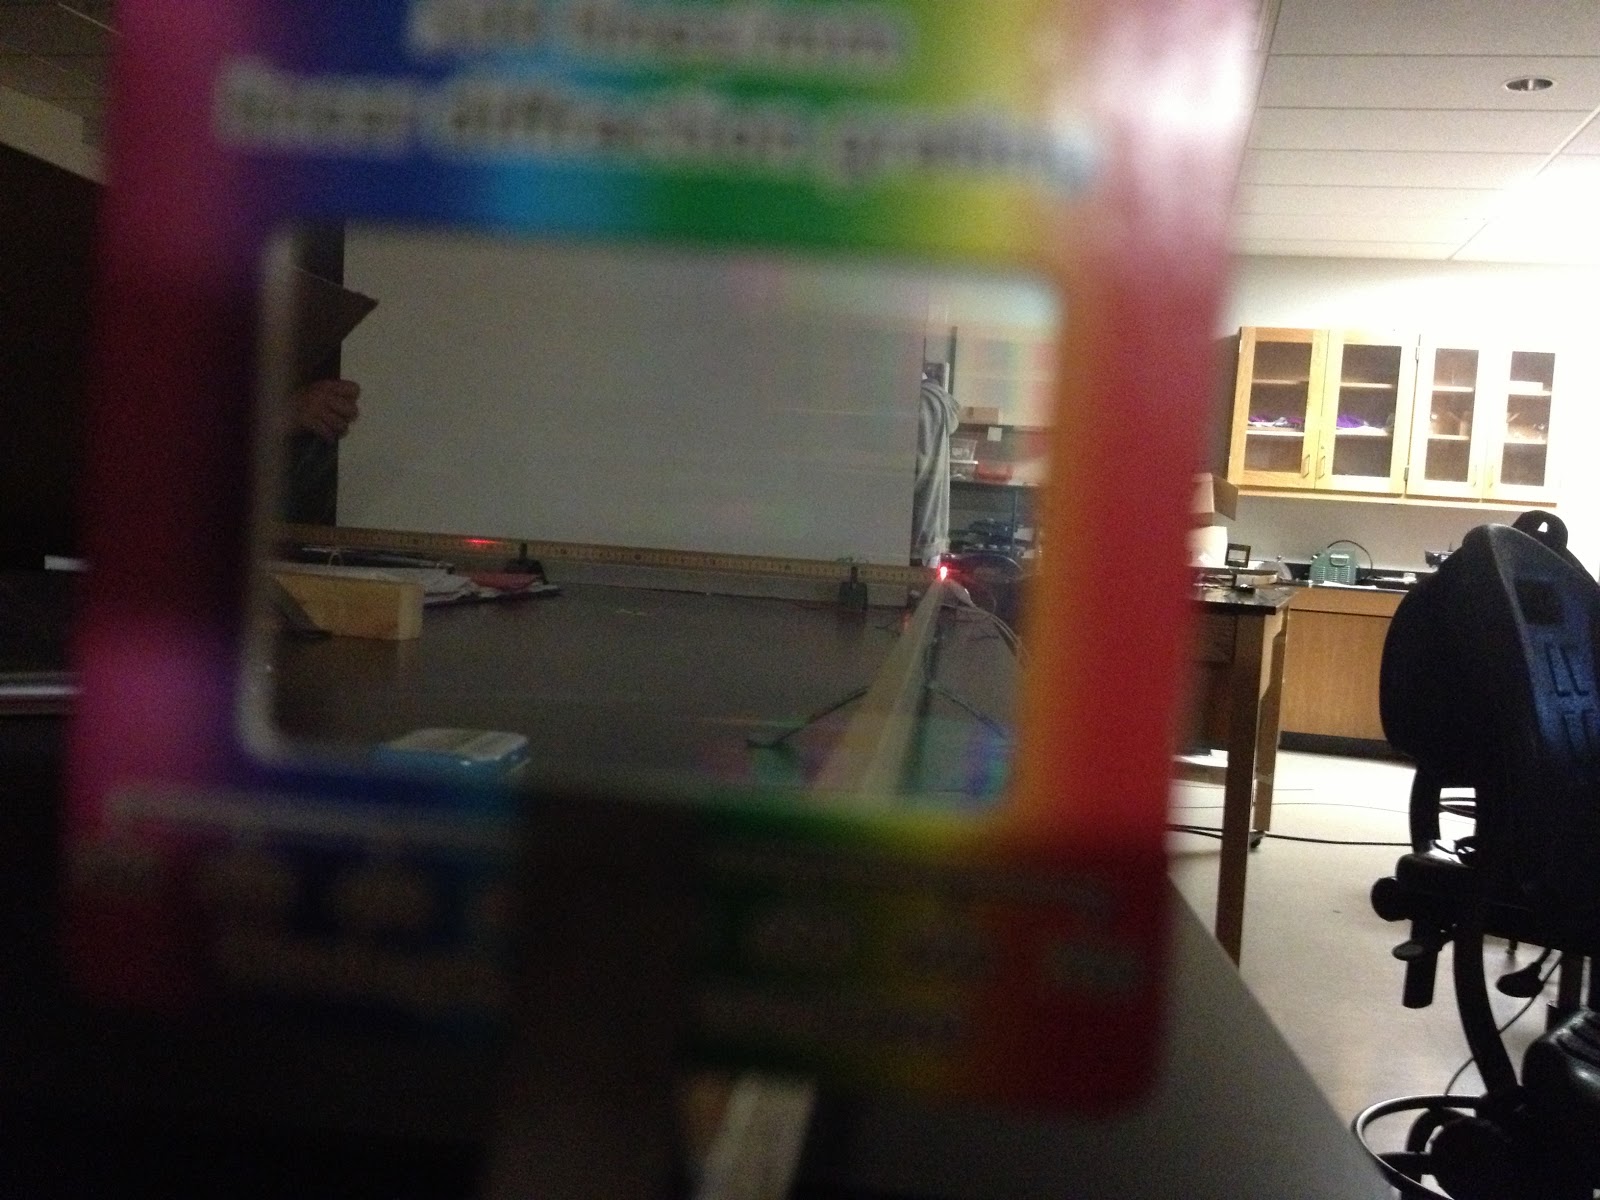
Set up

Set up
Red LED

Green LED

Blue LED

Yellow LED

White LED
If the LED doesn't glow, then swithch the polarity of the LED. This is because the depletion region is getting larger, it becomes a resistor. If switch the polarity, then the depletion region is getting smaller, so the current can pass through.
Data Analysis and Graphs


This slope was used to determine h
This slope was used to determine h max.
Average planck's constant:
color light
|
wavelength(nm)
|
voltage(V)
|
h (Js)
|
error(%)
|
red
|
606.82
|
1.89
|
6.12E-34
|
7.74
|
green
|
513.74
|
2.58
|
7.07E-34
|
6.58
|
yellow
|
570.066
|
1.92
|
5.75E-34
|
13.2
|
blue
|
456.08
|
2.65
|
6.46E-34
|
2.63
|
Average
|
6.35E-34
|
4.26
|
Questions
As looking through the spectroscope for each of the LED as to colors displayed on the scale, they are all one color instead of a mixture. The white LED gives a mixture of colors because white light reflects all colors of light. The yellow LED gives the largest error. According to the data table, the wavelengh decreases as the potential increases. The atmosphere scatters blue better than red because blue light has a higher frequency, but the red light has lower frequency, it is trapped or concentrated in the direction of the sun.
Conclusion
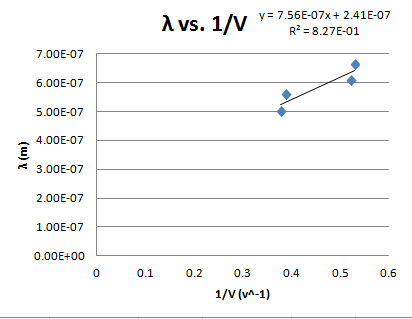
From the graph of lamda vs. 1/V, the plank's constant was determined to be 4.27*10^(-34)
± 0.54*10^(-34) Js, with a percent error of 33%± 5%. The theoretical value of plank constant, 6.63*10^(-34) Js does not lie within the uncertainty of our experimental data. However, the experimental plank constant determind from the formula, h= lamda (ev)/ c to be 6.35+/- 0.72 *10^(-34) Js, with a percent error of 0.16%. Therefore, the theoretical plank constant lies within the range of the h with uncertainty. The possible reason that why the h determined from the graph has a larger percent error is related the best-fit line. The R^2 value is 0.827 instead of 1, so some of our data points are not in this line, thus the h determined form the slope is not accurate.