Friday, April 5, 2013

4/1 Lenses

Purpose

     The purpose of this experiment was to observe characteristics of a converging lens when the object is placed on one side of the lens and the real inverted image is placed on the other side of the lens.

Experiment

 
Measuring the focal length: 5.0 ± 0.5 cm
 
 
Set up
 
Data and Analysis


d0(cm)
di±0.2(cm) h0±0.2(cm) hi±0.2(cm) Md Mh Type of image
5f=25±2.5 7.4 8.8 2.3 0.296±0.042 0.261±0.030 inverted and real
4f=20±2.0 8.4 8.8 3.4 0.42±0.058 0.386±0.033 inverted and real
3f=15±1.5 8.9 4 2.6 0.593±0.081 0.65±0.087 inverted and real
2f=10±1.0 11.8 4 4.5 1.18±0.153 1.125±0.112 inverted and real
1.5f=7.5±0.75 18.3 1.1 2.8 2.44±0.301 2.545±0.789 inverted and real
 
When object distance is 0.5f, the light rays could not form image on white board (virtual image). If look through the lens, we observed a bigger and upright image.


1/q = -1/p + 1/f
1/q = -m/p + b
so, m should be 1 and b should be 1/f (0.2 ± 0.02 cm^-1)
However, the experimental m= 0.82 and experimental b= 0.165.
% difference of m= (1-0.82)/1 X 100% = 18%
% difference of b = (0.2-0.165)/0.2 X 100% = 17.5% ± 7.5%
 
Conclusion
     According to table 1 and graph 1, as the object distance decreased, the image distance increased. Therefore, the image and object distance had inverse relationship as shown in graph 1. Also, the images formed from a converging lens is always real and inverted. When half of the lens was covered, the image became dimmer since the light passed through the lens was decreased by a factor of 2. Besides, as the object distance became closer to the lens, the image size and distance became larger. At 0.5f, there was no image because the image was between the vertex and the focus; hence, the image became virtual.
      The experimental m was 0.82, with a percent error of 18%; percent difference of b (1/f) was 17.5% ± 7.5%. Therefore, the percent difference of b lies within a range of 10-20%, and 10% was within the allowable range. The 20% difference could be the focus was not as accurate as it should have been. Unclear images at small object distances also contributed to this error. This was because the image became dimmer and unclearer as the object distance decreased. Hence, uncertainty became greater since it became harder to see the actual height of the image.


Tuesday, April 2, 2013

3/27 Mirrors

Purpose

     The purpose of this experiment was to characterize the images formed by convex and concave mirrors.

Experiment

 
Convex mirror
The image is smaller than the object.
The image is upright.
when you move closer to the mirror, the image is getting bigger.

 
Concave mirror
when the object is very far from the mirror: the image is smaller than the object; the image is inverted; the object and image are on the same side of the mirror.
when the object is close to the mirror: the image is larger than the object; the image is upright and blurry; the object and images are on the different side of the mirror.
 
Diagrams
 
 
Image in convex mirror changes depending on the object distance
 
 
Image in concave mirror changes depending on the object distance


Compute magnification of the mirrors
 
Data

Magnification ratio

Magnification of the mirror

Convex

Concave

hi/h0

0.318 ± 0.024

-0.339 ± 0.009

di/d0

-0.304 ± 0.023

0.297 ± 0.008
 
Conclusion
 
     The magnifications for the convex mirror were determined to be 0.314 from the ratio of image height and object height and 0.304 from the ration of the image distance and object distance. The maginifications for the concave mirror were determined to be -0.339 from the ratio of image height and object height and -0.297 from the ratio of the image distance and object distance. The uncertainty was 0.029, so all of the magnifications determined lied within this uncertainty range.


3/25 Introduction to Reflection and Refraction

Purpose

The purpose of this experiment was to explore the law of reflection, refraction, and total internal reflection.

Part A

 
Light ray box faced to the flat side of the len
 
 
Trial θ1 (±1) θ2 (±1) sin θ1 (±0.02) sin θ2 (±0.02)
1 0 0 0 0
2 5 3 0.09 0.05
3 10 6 0.17 0.10
4 15 8 0.26 0.14
5 20 13 0.34 0.23
6 25 14 0.42 0.24
7 30 18 0.50 0.31
8 35 22 0.57 0.37
9 40 26 0.64 0.44
10 45 27 0.71 0.45
11 50 28 0.77 0.47
12 55 31 0.82 0.52
13 60 33 0.87 0.55
14 65 35 0.91 0.57
15 70 36 0.94 0.59


The slope of this graph is the index of refractive glass, which is 1.56.
n1sinθ1= n2sinθ2
sinθ1/ sinθ2 = n2/n1 = n glass/ n air= n glass.
 
Part B
 
 
Light ray box faced to the curve side of the len
 
 
Trial θ1 (±1) θ2 (±1) sin θ1 (±0.02) sin θ2 (±0.02)
1 0 0 0 0
2 5 9 0.09 0.160
3 10 17 0.17 0.292
4 15 24 0.26 0.407
5 20 34 0.34 0.560
6 25 40 0.42 0.643
7 30 51 0.50 0.778
8 35 60 0.57 0.867
9 40 77 0.64 0.974
 
The slope of this graph is the reciprocal value of the index of refrative glass, which is 0.67.
n1sinθ1= n2sinθ2
sinθ1/ sinθ2 = n2/n1 = n air/ n glass= 1/ n glass
n1sinθcritical= n2sin90
θcritical = asin(n2sin90/n1) = 42 degress
Conclusion
 
      The index of refrative of glass was determined to be 1.6, and product of the slope in case 1 and 2 was 1 because their relationship is inversed. In case 2, we could not get a refraction when the incident angle was larger than 40 degress because it reached to the critial angle for a total internal reflection, which means there is only reflection and no refraction once the incident angle is greater and equal to the critical angle, and the critical angle was calculated to be 42 degress for this glass.


Monday, March 18, 2013

3/11 Introduction to Sound

Purpose
     The purpose of this experiment was to gain knowledge and understanding of sound waves by examing their characteristics such as the number of wave, frequency, period, amplitude, and wavelength. The relationships between these variables were calculated through different sound waves.

Part 1
 
Set up
 
 
First person said "AAAAAA"
 
 
Wave #1
 
 
Questions answered
 
 
Wave #1h (sample was 10 times longer than #1)
 
 
Graph #1 showed that the prediction was consistent with the experiment.
Part 2
 
Someone else said "AAAAA"
 
 
Wave # 2
 
 
Questions answered 
 
 
Part 3
 
 
Tunning fork wave collected
 
 
Wave # 3
The major difference of waves between human voice and a tunning fork: human voice wave is not sinusoidal (superposition of different waves) but a tunning fork wave is sinusoidal.
 
 
Part 4
 
 
Wave # 4: tunning fork created a soft sound.
 
     Wave 3 and 4 were created by a sound from the same tunning fork but with different loudness; therefore, they were expected to have the same wavelength and frequency but different amplitude because the loudness is dependent on the amplitude of the wave. The sound of tunning fork was made softer by striking it softer. The experimental data proved that the louder sound has a larger amplitude.


Friday, March 8, 2013

3/6 Standing Wave

Purpose

     The purpose of this experiment was to understand the standing wave driven by external force.

Experiment

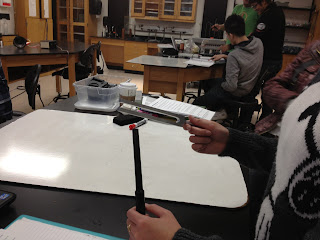
     The experiment was set up as the picture showed:
 
Data

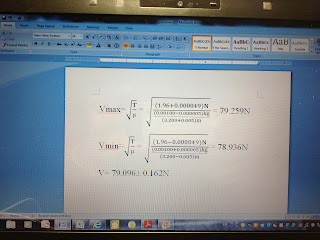
T= 1.96±0.000049N
Correction: the number of node was the number shown plus 2.
 
T= 0.49±0.000049N
 
Questions
 
     1. Found the wavelength and n for case 1, where T= 1.96±0.000049N.
                                  n= # of node -1
                                  L= nλ/2
                                  λ= 2L/n

Mode
ƒ(Hz)
Number of nodes
Distance between nodes(m)
λ (m)
n
fundemental
24±1
2
1.800±0.005
3.600±0.005
1
1st
47±1
3
0.900±0.005
1.800±0.005
2
2nd
71±1
4
0.600±0.005
1.200±0.005
3
3rd
94±1
5
0.450±0.005
0.900±0.005
4
4th
110±1
6
0.360±0.005
0.720±0.005
5
5th
150±1
7
0.300±0.005
0.600±0.005
6
6th
173±1
8
0.257±0.005
0.514±0.005
7
7th
195±1
9
0.225±0.005
0.450±0.005
8

 
     Found the wavelength and n for case 2, where T= 0.49±0.000049N
          
Mode
ƒ(Hz)
Number of nodes
Distance between nodes (m)
λ (m)
n
fundemental
10±1
2
1.800±0.005
3.600±0.005
1
1st
20±1
3
0.900±0.005
1.800±0.005
2
2nd
25±1
4
0.600±0.005
1.200±0.005
3
3rd
 ---
5
 ---
 ---
4
4th
45±1
6
0.360±0.005
0.720±0.005
5
5th
55±1
7
0.300±0.005
0.600±0.005
6
6th
65±1
8
0.257±0.005
0.514±0.005
7
 Note: the wave for third harmonic was hard to see.
 
     2. Plot of ƒ vs. 1/λ, where T= 1.96±0.000049N
 

% difference = (89.143-79.096/89.143) *100% = 11.3%
 
     3. Plot of ƒ vs. 1/λ, where T= 0.49±0.000049N


% difference = (39.599-32.786/39.599) *100% = 17.2%
 
     4. 
 
      5.
 
 
     6. 
 
Source of errors
The percent difference of the propagated speed from the plot and calculated from foumula v= sqrt T/u was 11.3%, where the tension was 1.96±0.000049N, and 17.2%, where T= 0.49±0.000049N. Possible errors could be the string we used streched when generating a wave; the mass hung did not provide enough tension, thus the string vibrated and affecting the generation of the wave.